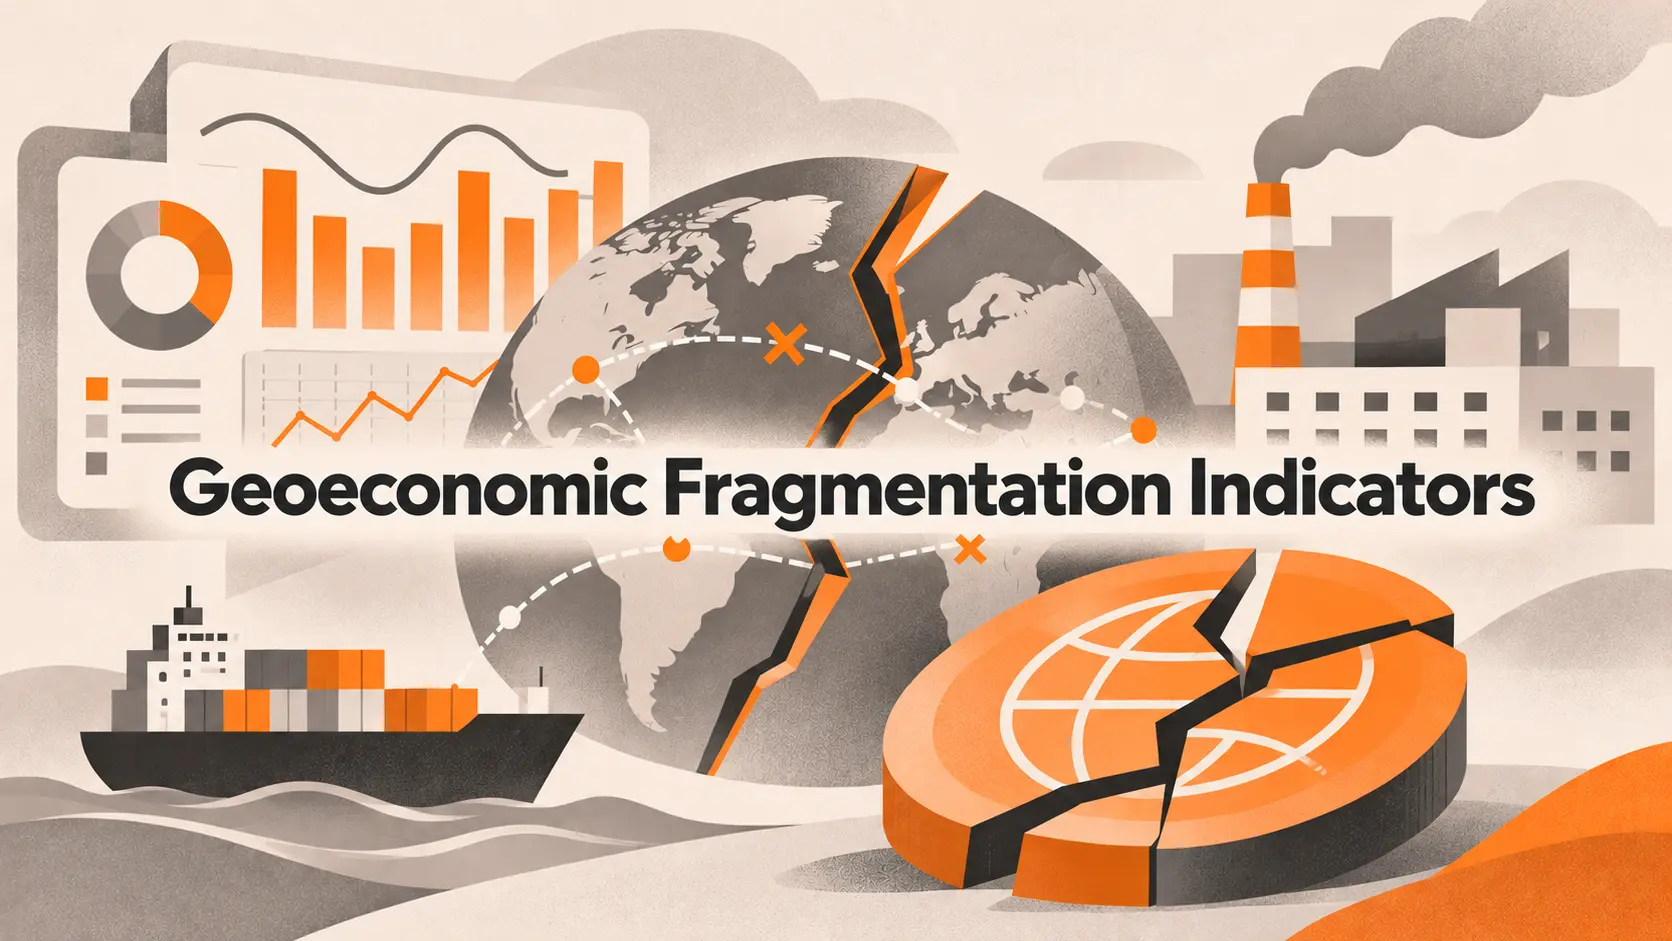
Geoeconomic fragmentation indicators measure whether trade, investment, and economic policy are becoming more divided along geopolitical lines. The most useful signals compare economic relationships between politically distant countries with those among closer partners, while checking whether changes reflect policy barriers rather than ordinary shifts in demand or prices. A single tariff announcement or a decline in one trade route is not enough to establish global fragmentation.
The broader concept of Geoeconomic Fragmentation explains why governments and firms are reorganizing international relationships. This article concentrates on the measurement problem: which data to track, how to construct meaningful comparisons, and how to distinguish genuine economic separation from trade diversion or normal market volatility.
What Counts as Evidence of Geoeconomic Fragmentation?
A useful indicator must show more than geopolitical tension. The relevant outcome is a measurable change in how countries exchange goods, allocate capital, share production inputs, or restrict market access. Researchers often start with bilateral observations because total global trade can rise even when previously important country pairs become less connected. The same logic applies to foreign direct investment and financial holdings.
Three questions structure the analysis. First, which connection changed, and by how much? Second, did economically comparable relationships change differently according to political alignment? Third, is there a plausible policy or business mechanism that explains the difference? When these questions cannot be answered, a data point may be important context but not convincing evidence of fragmentation.
The Core Indicators and Their Limitations
The most common monitoring tools cover realized economic flows, policy interventions, and geopolitical alignment. Each measures a different part of the process. The following comparison provides a practical starting set for analysts who need to distinguish early policy signals from changes already visible in the economy.
Main Indicators of Geoeconomic Fragmentation
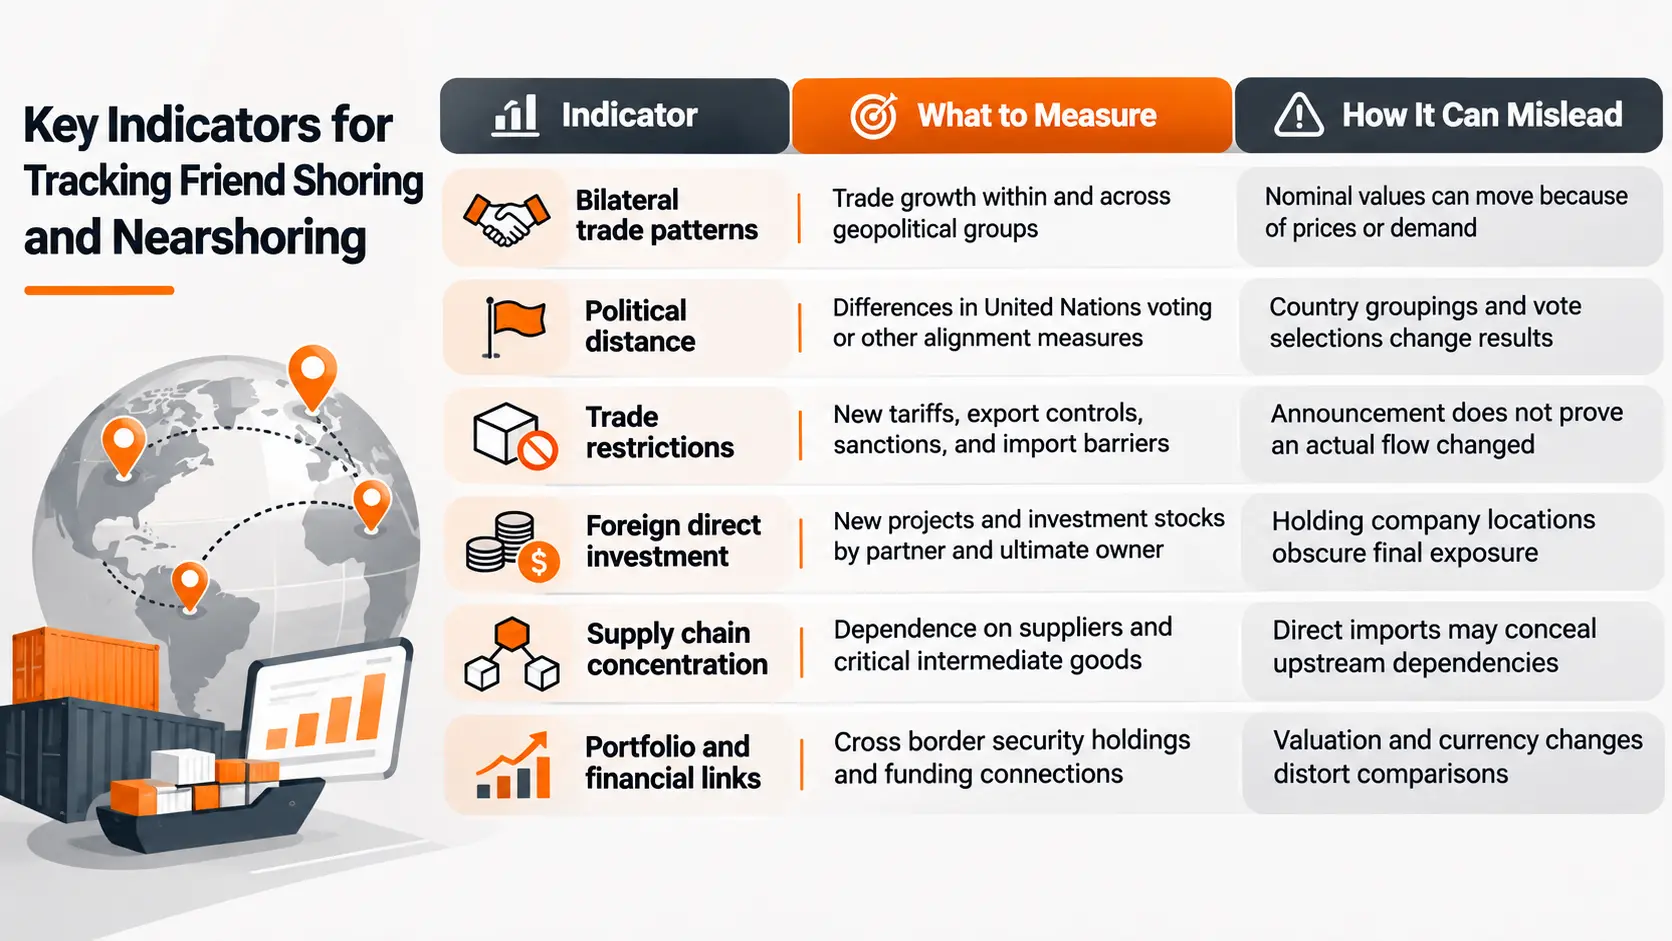
These indicators should be interpreted as a dashboard, not combined mechanically into one universal score. Restrictions can precede changes in trade by months or years, while business investment responses are often slower than goods shipments. An analyst who treats all six as interchangeable risks counting the same event several times or confusing policy intent with economic effect.
Measuring Trade Fragmentation with Bilateral Data
Trade is a useful starting point because partner level import and export records are widely available. One simple test asks whether trade between politically distant economies grows more slowly than trade among politically aligned economies after an identifiable shock. It is essential to compare growth rates over the same period rather than merely report that one group trades more. Large trading partners usually trade more for economic reasons even before geopolitics enters the picture.
The World Trade Organization reported in its March 2026 Global Trade Outlook that trade between hypothetical geopolitical blocs had grown about four percent more slowly than trade within those blocs following the invasion of Ukraine. Its updated analysis also pointed to renewed divergence during 2025. Those results concern comparisons constructed from specific country groupings and trade series; they are not a claim that global trade as a whole contracted by four percent.
A careful comparison should adjust for economic size, geographic distance, sector composition, exchange rates, and common shocks. Researchers often use gravity models for this purpose. Without these controls, a decline in bilateral shipments could be mistaken for political fragmentation even when it reflects an energy price cycle or a shift in consumer demand.
Geopolitical Distance Is Not Geographic Distance
Political alignment is difficult to reduce to a permanent label. A widely used empirical approach estimates geopolitical distance from voting behavior in the United Nations General Assembly. Researchers can compare countries using similarity of voting positions or estimated ideal point distances. Such measures help explain why physically distant countries may strengthen trade while neighbors become less connected.
Yet the measurement choices matter. A September 2025 study from the Federal Reserve Bank of St. Louis shows that findings change with the observation period and the kinds of votes included. A classification that works well for one conflict may not describe alignment in trade, finance, or technology more generally. Analysts should test results under alternative definitions instead of presenting political blocs as fixed natural categories.
This distinction also guards against conflating political sourcing with geographic relocation. Friend shoring measures preference for aligned partners, whereas nearshoring emphasizes proximity. The evidence for these two behaviors can differ, so trade routes becoming more politically aligned should not automatically be described as supply chains becoming shorter.
Investment and Financial Fragmentation Signals
Trade flows respond quickly to purchasing decisions, but foreign direct investment reflects commitments that can last decades. Analysts should examine both new project announcements and realized investments, separating immediate investor jurisdictions from ultimate owners where data allow. An investment routed through a financial center may have a different economic origin from the country listed as its direct source.
The IMF study Changing Global Linkages: A New Cold War? estimated lower trade and foreign direct investment between geopolitically distant groups relative to connections within groups after 2022. Yet another IMF study, How Widespread is FDI Fragmentation?, found no clear evidence of global geopolitical fragmentation in its particular foreign direct investment samples and measurement framework. These results are not necessarily contradictory because their periods, units of analysis, and definitions differ. They show why one research result should not be treated as a permanent global fact.
Portfolio investment introduces additional complications. Security prices, currency movements, and valuation changes can shift recorded holdings even when investors do not actively reallocate. Where possible, use transaction flows alongside holdings and identify custodial centers that may conceal ultimate exposure. Observed financial decoupling needs stronger evidence than one quarterly change in a headline investment stock.
Policy Measures as Leading Indicators
Tariffs, sanctions, export controls, procurement preferences, and investment screening are possible leading indicators because they can alter future business decisions. A useful policy dataset records when a measure became effective, which products or entities it covers, the economies affected, its stated objective, and whether exemptions apply. Counting measures alone is unreliable because one broad restriction can affect far more trade than dozens of narrow actions.
Policy intensity also needs to be connected to exposure. A new control on a strategically important component may have wider consequences than a tariff on a low value product. Conversely, firms may use inventories or substitute suppliers to absorb restrictions, leaving aggregate trade relatively stable. This gap between announced restrictions and realized outcomes should be explicit in any monitoring report.
A Practical Dashboard for Tracking Fragmentation
An effective dashboard combines a small set of related indicators, a clear baseline, and a rule for reassessing conclusions. The goal is to detect persistent changes in economic relationships rather than react to every geopolitical headline. The example below is a conceptual monitoring structure; its review intervals are illustrative and do not represent a universally accepted statistical standard.
How to Avoid False Signals
One frequent mistake is to interpret a declining trade share as a decline in trade value. A country can export more to a partner in absolute terms while that partner accounts for a smaller share of its expanding total trade. Another is to mistake an increase in nominal trade for greater real integration when the main driver is higher commodity prices. Where feasible, analysts should compare both values and volumes and identify the relevant denominator.
A second mistake is to assume a direct bilateral relationship captures the full supply chain. Goods can pass through connector economies before reaching the final market. Reexports and intermediate inputs may preserve an indirect link even as direct imports fall. Measuring trade in value added or examining upstream sources can reveal this dependence, though the required data are less timely and often incomplete.
A third mistake is to describe geopolitical blocs as though membership never changes. Voting patterns, policy priorities, and industry specific relationships can all shift. Robust findings should survive reasonable changes in classifications, years, and model assumptions. The December 2025 Federal Reserve analysis of trade fragmentation also cautions that country and product effects are neither uniform nor necessarily symmetric for imports and exports.
What the Latest Evidence Actually Suggests
The evidence does not support the simplistic conclusion that global exchange is ending. UN Trade and Development reported that trade in goods and services surpassed 35 trillion dollars in 2025 even as policy uncertainty and changes in trade relationships continued. The coexistence of record trade and shifting partner relationships is precisely why the structure of trade matters alongside its total value.
The WTO and Federal Reserve research supports paying attention to politically distant trading relationships, but the intensity of adjustment differs by country, sector, and period. Some economies become alternative suppliers or transit partners, while others face lost market access. Financial evidence is even less suitable for a one number verdict. A careful reading recognizes sector specific changes and qualified findings instead of declaring a universal split into isolated economic blocs.
How Businesses and Investors Can Use These Indicators
Businesses can translate country level research into exposure maps covering their critical inputs, key markets, investment locations, and payment dependencies. For a manufacturer, supplier concentration and licensing restrictions may matter more than the global trade growth rate. For a financial investor, ultimate ownership, funding channels, and regulatory restrictions may be more relevant. The indicators should match the actual decision at risk.
A practical review begins by identifying the essential cross border relationship, then testing whether its costs, legal access, or reliability have changed. A response might include qualifying an alternative supplier, changing contract terms, or scenario testing a delayed investment. These actions should follow documented exposure and plausible thresholds rather than headlines alone. The analysis is strongest when it specifies both the economic mechanism and what evidence would overturn the initial judgment.
Geoeconomic fragmentation indicators work best as a disciplined comparison of economic connections rather than a single headline statistic. Bilateral trade, political distance, investment, policy restrictions, and supply chain dependencies each contribute different evidence. Read together, with consistent baselines and attention to indirect flows, they help reveal where geopolitical divisions are changing economic activity and where apparent fragmentation is only a statistical illusion.
FAQ
What is the best indicator of geoeconomic fragmentation?
There is no universally best indicator. Bilateral trade patterns relative to geopolitical alignment are a common starting point, but investment, policy restrictions, and sector exposure help confirm the interpretation.
Can global trade grow while fragmentation increases?
Yes. Total trade may grow while certain country pairs trade less than comparable partners. Fragmentation concerns the structure of relationships as well as aggregate volumes.
How is geopolitical distance measured?
Researchers often use differences in United Nations voting positions or derived alignment estimates. Results depend on which votes, years, and classifications are included.
Do tariffs prove that an economy is fragmenting?
Not by themselves. Tariffs are policy signals. Analysts need to assess their coverage and observe whether trade, investment, or supply chains actually change.
Is nearshoring evidence of geopolitical fragmentation?
Not automatically. Geographic proximity and political alignment are separate factors. A shift toward nearby suppliers can occur without a corresponding geopolitical shift.
Why do studies reach different conclusions about foreign direct investment?
Studies use different periods, partner definitions, immediate versus ultimate ownership, and estimation methods. These choices can materially affect measured outcomes.

Masoumeh Jahangard
Markets & Economy Writer at PinerookMasoumeh Jahangard covers markets, economic trends, and business conditions for Pinerook, focusing on how they affect startups and growing companies.
 Seen first.