
A startup can increase revenue, attract customers, and expand its operations without necessarily becoming financially stronger. Higher sales may require greater spending, customer acquisition can become more expensive, and existing customers may leave before generating meaningful returns. Founders who focus only on revenue or user growth risk overlooking financial problems that can eventually affect the company's ability to operate.
Startup financial metrics help founders understand what is happening beneath those headline numbers. Within the broader framework of Startup Finance, these measurements connect business performance with profitability, customer economics, capital efficiency, and financial sustainability. Their purpose is not simply to describe results but to provide reliable evidence for decisions about spending, pricing, growth, and investment.
This guide explains the financial KPIs startups should understand, how to calculate and interpret them, and which indicators matter at different stages of development. It also includes a practical financial dashboard, a break even calculation, and examples demonstrating why individual metrics should be evaluated together.
What Are Startup Financial Metrics?
Startup financial metrics are measurable indicators used to evaluate a company's revenue performance, profitability, customer economics, and financial capacity. They help founders determine whether the business is creating value, using resources efficiently, and developing a more sustainable operating model.
Financial metrics differ from general activity measurements. Website traffic, application downloads, and social media followers may indicate interest, but they do not necessarily demonstrate that customers generate enough revenue to support the business.
A startup with thousands of users may still face financial difficulties if few become paying customers or if serving them costs more than the revenue they produce.
The most useful financial metrics answer specific management questions. Is revenue growing? Are sales profitable after direct costs? How expensive is customer acquisition? Do existing customers remain valuable? Can the company support its financial obligations?
No single number answers every question. Founders need a focused combination of indicators rather than a dashboard filled with measurements that rarely influence decisions.
Why Financial Metrics Matter for Startups
Startups frequently make important financial decisions before their outcomes become clear. Product development, hiring, customer acquisition, and market expansion require resources, while the resulting revenue may take months to materialize.
Financial metrics provide evidence about whether those investments are producing meaningful results.
For example, increasing revenue may suggest that a marketing campaign is successful. However, if acquisition costs rise faster than customer value, the campaign may not support sustainable growth.
Reliable measurements also improve communication between founders, employees, and investors. Consistent definitions make it easier to compare performance across reporting periods and identify changes that require attention.
The objective is to understand not only how quickly the company is growing but also the financial quality of that growth.
Essential Startup Financial Metrics at a Glance
Different metrics serve different purposes. Some measure growth, others describe profitability, and several reveal whether customer relationships or financial resources can support future operations.
The following table summarizes important startup financial metrics and their practical applications.
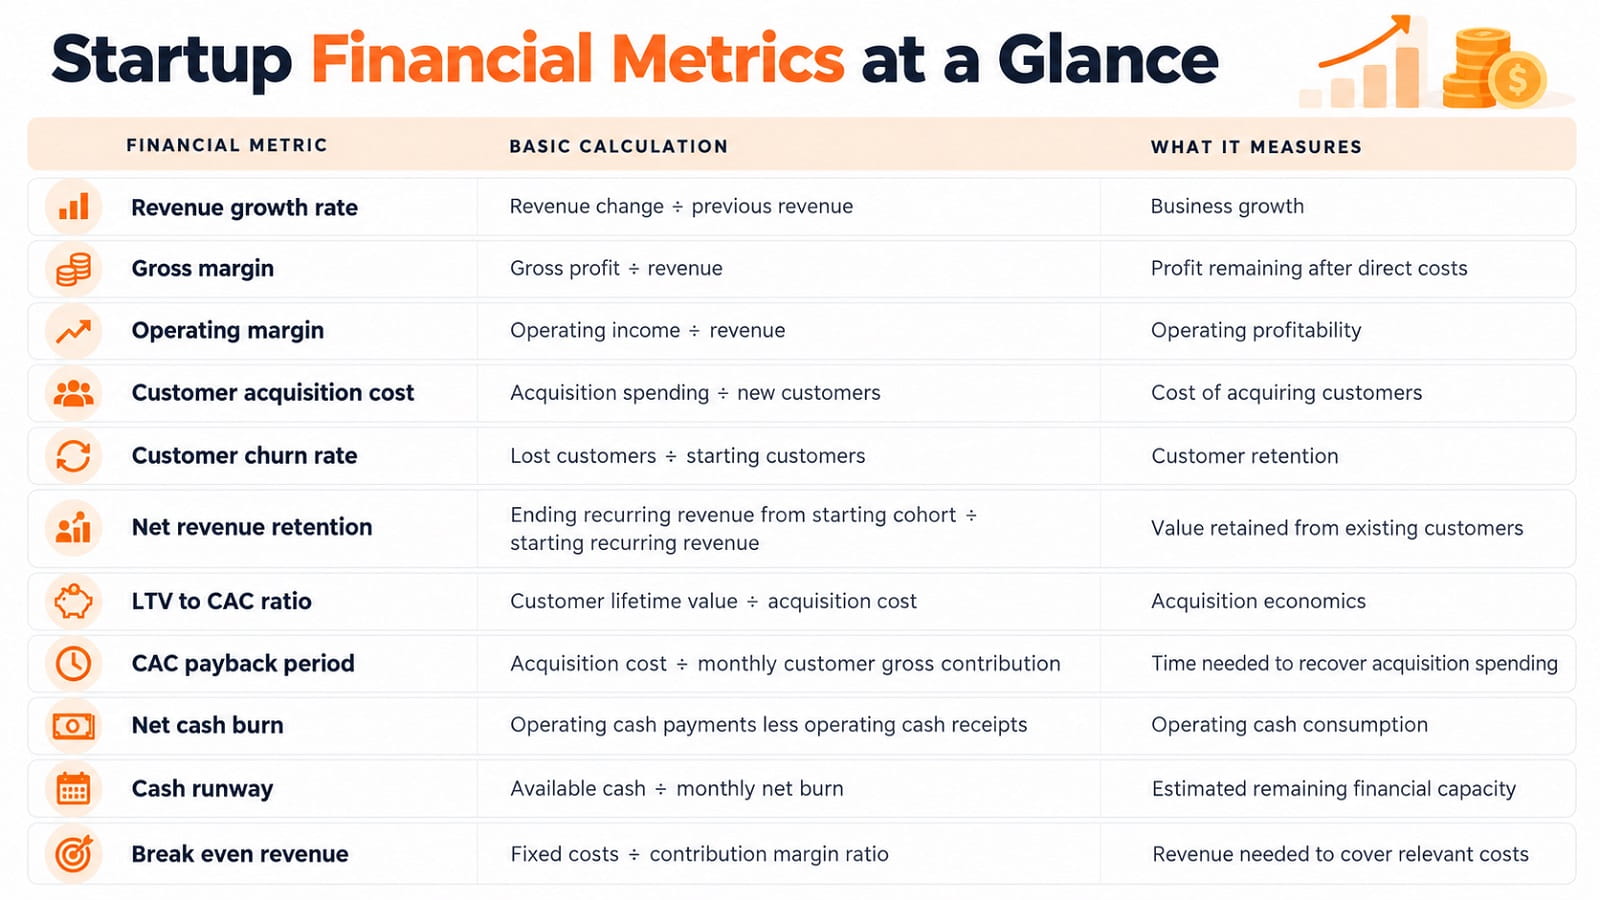
These calculations provide simplified starting points. Accurate reporting requires consistent definitions, comparable periods, and a clear understanding of the expenses and customers included.
Some metrics apply to nearly every business, while others are more useful for subscription companies or startups with repeat customer relationships.
Revenue Metrics: Measuring Business Growth
Revenue metrics help founders understand whether customer demand is increasing and how effectively that demand becomes recognized business income.
Revenue Growth Rate
Revenue growth rate measures the percentage change in revenue between comparable periods.
Revenue growth rate = (Current revenue less previous revenue) ÷ Previous revenue × 100
If a startup generates $120,000 in revenue this month compared with $100,000 in the previous month, its monthly revenue growth rate is 20%.
However, the source of growth matters. A single large contract can temporarily increase reported revenue without establishing a dependable pattern.
Founders should distinguish growth from existing customers, new customers, pricing changes, and exceptional transactions.
Monthly Recurring Revenue and Annual Recurring Revenue
Monthly recurring revenue, or MRR, measures subscription revenue normalized to a monthly amount. Annual recurring revenue, or ARR, expresses the recurring revenue base on an annualized basis.
For a business with stable monthly subscriptions:
ARR = MRR × 12
A startup generating $50,000 in qualifying MRR has an annualized recurring revenue figure of $600,000.
ARR is not the same as guaranteed future cash receipts or recognized annual revenue. One time setup fees and nonrecurring services should not be included simply because they appear in customer invoices.
These indicators are especially important for subscription businesses because recurring revenue can provide greater visibility into continuing customer relationships.
Average Revenue per Account
Average revenue per account, or ARPA, measures the average revenue generated by each customer account during a defined period.
For a subscription startup, monthly ARPA can be calculated by dividing MRR by the number of active paying accounts at the same measurement date.
This helps founders identify changes in pricing, customer mix, and account expansion.
However, increasing average revenue is not automatically beneficial if it results from losing many customers or becoming excessively dependent on a small number of large accounts.
Profitability Metrics: Understanding Financial Value
Revenue growth matters, but founders also need to understand how much value remains after the business delivers its products and covers operating expenses.
Gross Margin
Gross margin measures the percentage of revenue remaining after deducting direct costs associated with producing or delivering the product.
Gross margin = (Revenue less cost of revenue) ÷ Revenue × 100
If a startup generates $100,000 in revenue and incurs $25,000 in direct delivery costs, its gross margin is 75%.
This means $75,000 remains before other operating expenses, including many administrative, marketing, and development activities.
Gross margins vary considerably across business models, so founders should use consistent cost classifications when making comparisons.
Contribution Margin
Contribution margin measures the revenue remaining after relevant variable costs are deducted.
For an ecommerce business, these costs may include purchased goods, payment processing, shipping, and transaction related expenses.
Contribution margin helps founders evaluate whether additional sales contribute enough value to support fixed costs and other business requirements.
A company can experience rapid revenue growth while generating little additional financial value if variable costs consume most of the increase.
Operating Margin
Operating margin compares operating income with revenue.
Operating margin = Operating income ÷ Revenue × 100
A negative operating margin indicates that recognized revenue does not cover all operating expenses during the period.
This may be expected when a startup invests heavily in development. However, management should evaluate whether operating performance is improving as revenue grows.
Break Even Point: When Does a Startup Cover Its Costs?
The break even point identifies the level of sales at which revenue covers the costs included in the analysis, producing neither an operating profit nor an operating loss under those assumptions.
For a simplified model based on fixed costs and a contribution margin ratio:
Break even revenue = Fixed costs ÷ Contribution margin ratio
Suppose a startup has monthly fixed costs of $60,000 and a contribution margin ratio of 40%.
Break even revenue = $60,000 ÷ 0.40 = $150,000
Under these assumptions, the company needs approximately $150,000 in monthly revenue to cover its relevant fixed and variable costs.
Below that amount, the simplified model indicates an operating loss. Above it, additional contribution can generate operating profit.
However, reaching accounting break even does not guarantee positive cash flow. Customer payment delays, equipment purchases, financing obligations, and other cash movements can create liquidity pressure even when the business reports no operating loss.
Founders should therefore evaluate break even performance alongside actual cash requirements.
Customer Acquisition and Retention Metrics
A startup's financial performance depends partly on how much it spends acquiring customers and how much value those relationships create over time.
Customer Acquisition Cost
Customer acquisition cost, or CAC, estimates the resources required to obtain a new paying customer.
CAC = Acquisition spending ÷ New paying customers
Relevant spending can include advertising, sales compensation, commissions, and supporting acquisition costs.
For reliable comparisons, founders must use consistent spending definitions and account for delays between marketing investment and customer conversion.
Customer Churn Rate
Customer churn rate measures the proportion of existing customers lost during a defined period.
Customer churn rate = Customers lost ÷ Customers at the beginning of the period × 100
If a startup begins a month with 400 paying customers and loses 10, its monthly customer churn rate is 2.5%.
New customers acquired during the period should not be added to the starting denominator.
Churn provides essential context for customer growth. A startup can acquire many customers without increasing its overall customer base significantly if existing customers continue leaving.
Net Revenue Retention
Net revenue retention, or NRR, measures changes in recurring revenue from customers who were already present at the beginning of a period.
It includes expansion, contraction, and cancellations but excludes revenue from newly acquired customers.
NRR = (Starting recurring revenue + Expansion less contraction less churned recurring revenue) ÷ Starting recurring revenue × 100
A result above 100% means expansion among existing customers exceeds revenue lost through cancellations and reductions.
Strong NRR can indicate valuable existing customer relationships, but it does not automatically establish that the business is profitable or financially sustainable.
Customer Lifetime Value and the LTV to CAC Ratio
Customer lifetime value, or LTV, estimates the economic value a customer may generate throughout the relationship.
For financial decision making, a useful LTV calculation focuses on expected gross contribution rather than customer revenue alone.
A simplified approach is:
LTV = Average monthly customer gross contribution × Expected customer lifetime in months
Suppose a customer is expected to contribute $160 in monthly gross profit and remain active for 20 months.
Estimated LTV = $160 × 20 = $3,200
If acquiring that customer costs $800:
LTV to CAC ratio = $3,200 ÷ $800 = 4
The result is expressed as a ratio of 4 to 1.
This suggests that estimated lifetime gross contribution is four times the initial acquisition expenditure.
However, LTV is a forecast rather than guaranteed income. Its accuracy depends on customer retention, pricing, margin stability, and the quality of historical information.
A startup with limited customer history should avoid relying on optimistic lifetime assumptions. Comparing actual customer cohorts over time often provides a more dependable foundation for these estimates.
The ratio also excludes some operating and capital requirements, so an apparently attractive result does not necessarily mean the entire business is profitable.
Customer Acquisition Payback Period
The CAC payback period estimates how long it takes to recover customer acquisition spending through the gross contribution generated by a customer.
CAC payback period = CAC ÷ Monthly gross contribution per customer
Using the previous example, an acquisition cost of $800 and monthly gross contribution of $160 produce a payback period of five months.
This means the customer would recover the initial acquisition expenditure through gross contribution after approximately five months, assuming that contribution remains consistent.
A shorter payback period generally allows acquisition capital to be recovered sooner. However, comparisons should account for customer type, contract structure, payment timing, and acquisition costs.
Founders should not confuse recovering acquisition expenditure with recovering every operating expense incurred by the business.
Cash Health Metrics: Understanding Financial Capacity
A startup can report improving revenue and attractive margins while still consuming more cash than it collects.
Monthly net cash burn measures operating cash consumption when operating payments exceed operating receipts.
Net cash burn = Operating cash payments less operating cash receipts
A business collecting $90,000 from customers while paying $140,000 for operations has monthly net operating cash burn of $50,000.
Cash runway translates this consumption into an estimate of how long available resources may last.
Cash runway = Available cash ÷ Monthly net cash burn
With $600,000 in unrestricted cash and monthly burn of $50,000, the simplified runway is 12 months.
These indicators provide financial context for growth decisions. They should be interpreted alongside forward cash forecasts because hiring, customer collections, and planned investments may change future consumption.
Example: A Startup Financial Metrics Dashboard
Consider AsterCloud, a fictional subscription software startup preparing its monthly financial report.
At the beginning of the month, AsterCloud has 400 paying accounts generating $80,000 in MRR. During the month, it acquires 40 new accounts contributing $10,000 in MRR, loses 10 existing accounts representing $2,000, and generates $4,000 in expansion revenue from retained accounts.
The company finishes with 430 paying accounts and $92,000 in MRR.
For the same month, recognized revenue is $90,000, direct delivery costs are $22,500, and acquisition spending totals $40,000.
Operating cash receipts are $88,000, operating cash payments are $138,000, and unrestricted closing cash is $600,000.
These figures produce the following dashboard.
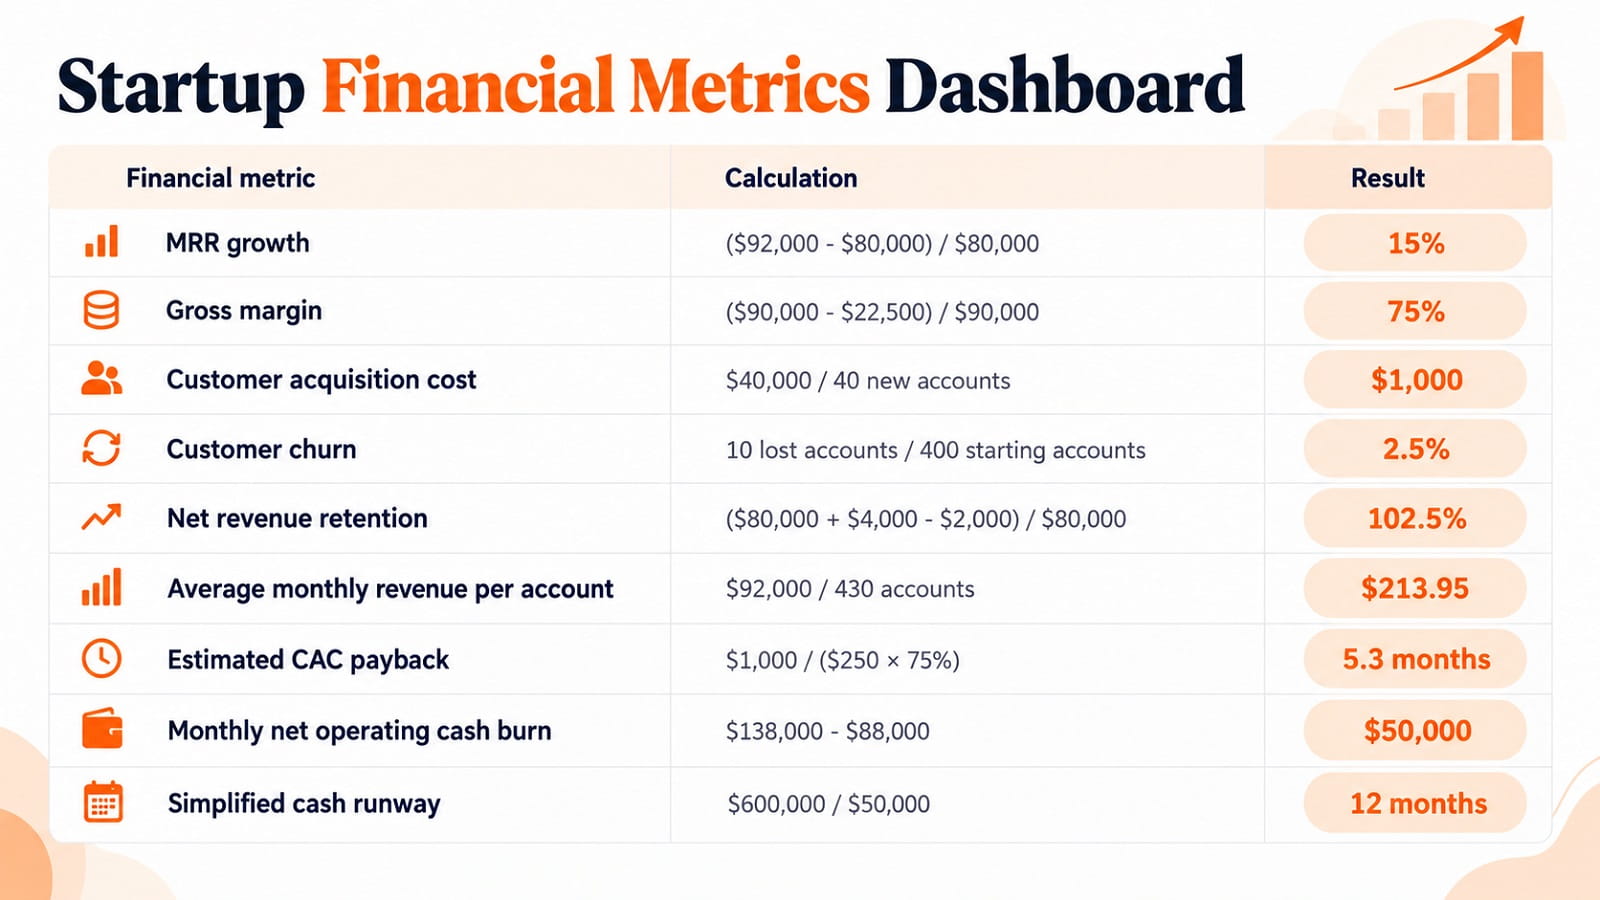
The figures are illustrative rather than industry benchmarks. The payback estimate assumes that the company's 75% gross margin is representative of newly acquired customers and that the new accounts generate $250 in MRR each.
The dashboard also distinguishes recognized revenue, recurring revenue, and cash receipts. These amounts measure different aspects of performance and should not be treated as interchangeable.
How to Interpret Financial Metrics Together
AsterCloud's MRR growth of 15% indicates that its recurring revenue base expanded during the month. Its NRR of 102.5% also suggests that expansion among existing customers exceeded lost recurring revenue.
However, these positive indicators do not establish that the company is financially sustainable.
AsterCloud spent $40,000 acquiring new accounts and continues consuming $50,000 in operating cash each month. Management needs to determine whether improving customer contribution and retention can eventually reduce this consumption.
Its estimated CAC payback period of 5.3 months provides an additional perspective on acquisition efficiency. Nevertheless, the result relies on assumptions about customer contribution remaining stable.
The simplified 12 month runway gives founders a financial planning reference, but planned hiring or changing collections could materially affect the actual outcome.
The important conclusion comes from combining the measurements. Revenue is growing, existing customer relationships are expanding, customer acquisition requires capital, and financial resources remain limited.
Management can use this information to investigate whether growth investments are improving the company's future financial position.
Choosing KPIs for Different Startup Stages
The most important financial KPIs change as a startup develops. Founders should select measurements that reflect the decisions they currently need to make.
Before Consistent Revenue
A startup without reliable customer revenue should prioritize available cash, essential spending, expected financial commitments, and the costs associated with early product delivery.
Detailed lifetime value estimates may be unreliable because the business has insufficient customer history.
At this stage, accurate financial information is more valuable than an extensive dashboard filled with speculative metrics.
Early Revenue Stage
Once customers begin paying consistently, founders can focus on revenue growth, gross margin, acquisition costs, and initial customer retention.
The objective is to determine whether the business can attract customers economically and deliver products without consuming excessive resources.
Revenue quality matters as much as growth because occasional sales may not indicate dependable future demand.
Repeatable Growth Stage
As acquisition and customer retention patterns become more predictable, metrics such as CAC payback, NRR, contribution margin, and customer cohort performance become increasingly useful.
Founders can begin comparing customer segments and acquisition channels to identify where investment creates the strongest financial contribution.
Expansion Stage
Startups expanding into new markets or products need additional visibility into operating margins, financial efficiency, cash requirements, and performance differences across business units.
At this stage, management may also monitor customer concentration, working capital, and the financial consequences of larger investments.
The objective is to maintain reliable decision making as the organization becomes more complex.
Financial Metrics for Different Startup Business Models
Not every startup should use the same financial dashboard. The business model determines which measurements provide the most useful information.
SaaS Startups
Subscription software companies often prioritize MRR, ARR, gross margin, customer churn, NRR, CAC, and acquisition payback.
Recurring customer relationships make retention and revenue expansion particularly important.
Ecommerce Startups
Ecommerce companies should pay close attention to gross margin, contribution margin, average order value, product returns, inventory costs, and cash tied up in stock.
Revenue growth may increase working capital requirements because products often need to be purchased before customers buy them.
Marketplace Startups
Marketplace companies need to distinguish transaction value from the revenue earned by the platform.
Gross merchandise value represents the total value of transactions facilitated, while platform revenue depends on the applicable commercial arrangement.
Take rate, transaction contribution, and repeat purchasing can provide more meaningful information about the underlying economics.
Service Startups
Service businesses may prioritize project gross margin, revenue per employee, customer concentration, utilization, and collection periods.
Even profitable projects can produce financial pressure when contractors and employees must be paid long before clients settle invoices.
How to Build a Reliable Startup KPI Dashboard
A useful dashboard should provide enough information to support decisions without becoming unnecessarily complicated.
Founders should begin by selecting a focused group of indicators covering growth, profitability, customer economics, and financial capacity.
Every metric needs a documented definition. The company should specify the reporting period, included transactions, customer population, and treatment of refunds, discounts, or unusual expenses.
Data should come from reliable accounting, billing, banking, and customer management systems. Important differences between those records should be reconciled before management relies on the results.
Review Changes Over Time
An isolated measurement rarely explains the company's complete financial position.
Founders should compare current results with earlier periods and investigate significant changes.
A declining CAC might indicate improving acquisition efficiency, but management should also verify whether newly acquired customers remain valuable over time.
Segment Metrics When Necessary
Company averages can conceal meaningful differences between customer groups.
Enterprise customers may have different acquisition costs, payment terms, and retention patterns than smaller accounts.
Segmenting metrics by customer cohort, product, or acquisition channel can help management understand which parts of the business contribute most effectively to growth.
However, segmentation is only useful when sufficient data is available to support meaningful comparisons.
Connect Metrics to Business Decisions
Every primary KPI should help answer a management question.
If gross margin declines, founders should examine pricing and direct costs. If churn increases, they should investigate customer dissatisfaction, competitive pressure, or changes in customer needs.
If cash consumption rises more quickly than expected, management should review spending commitments and update its financial forecast.
A dashboard becomes valuable when reported changes lead to informed investigation and action.
Common Mistakes When Tracking Startup Financial Metrics
One common mistake is measuring too many indicators without identifying which ones influence important decisions. A large dashboard can create the appearance of control while hiding the most significant financial problems.
Another is using inconsistent definitions. If sales salaries are included in CAC during one period but excluded during another, the resulting comparison becomes unreliable.
Founders may also confuse recognized revenue with cash collected or recurring revenue with total sales. These measurements describe different aspects of business performance.
Overly optimistic customer lifetime assumptions can make acquisition economics appear stronger than the underlying evidence supports.
Comparing businesses using different cost structures or reporting methods can create similarly misleading conclusions.
Finally, a strong individual metric should not be treated as proof of overall financial health. High revenue growth does not guarantee profitability, and attractive customer acquisition economics do not guarantee sufficient cash to support operations.
Financial indicators are most useful when interpreted together and connected to actual business conditions.
Final Thoughts
Startup financial metrics provide a clearer picture of business health than revenue growth or customer counts alone. They help founders understand whether growth creates financial value, whether customer relationships justify acquisition spending, and whether available resources can support future plans.
The most effective financial dashboard combines a focused selection of revenue, profitability, customer, and cash indicators. Consistent definitions, reliable data, and regular reviews make those measurements useful.
Ultimately, financial reporting creates value when founders understand what the numbers mean, why they change, and how they can support better decisions about spending, growth, and financial sustainability.
FAQ
What Are the Most Important Financial Metrics for Startups?
Important startup financial metrics include revenue growth, gross margin, customer acquisition cost, customer retention, net cash burn, and available cash runway. Subscription businesses may also prioritize recurring revenue and net revenue retention. The most useful selection depends on the business model and development stage.
How Many Financial KPIs Should a Startup Track?
There is no universal number. Early stage businesses can begin with a small group of indicators covering revenue, direct costs, available cash, and customer economics. Additional metrics should be introduced when they support specific decisions and reliable data becomes available.
What Is a Good LTV to CAC Ratio?
A higher ratio indicates more expected customer value relative to acquisition spending, but no single target applies universally. Founders should consider gross contribution, retention assumptions, payback timing, and operating requirements rather than relying exclusively on one benchmark.
How Do You Calculate a Startup's Break Even Point?
For a simplified sales based calculation, divide fixed costs by the contribution margin ratio. If monthly fixed costs are $60,000 and the contribution margin ratio is 40%, the business needs approximately $150,000 in monthly revenue to cover those costs under the stated assumptions.
Can a Startup Have Strong Metrics and Still Lose Money?
Yes. A startup can report rapid revenue growth, strong customer retention, and attractive gross margins while remaining unprofitable. Operating expenses and investment requirements may still exceed revenue or available cash generation.
What Financial Metrics Do Startup Investors Look At?
Investors may examine revenue growth, recurring revenue, gross margin, customer acquisition efficiency, retention, cash consumption, and future funding requirements. The emphasis varies according to the company's maturity, industry, and business model.
How Often Should Startup Financial Metrics Be Reviewed?
Many startups review selected operating and cash indicators weekly and prepare a broader financial dashboard monthly. Detailed cohort analysis and strategic evaluations may use longer periods when additional data is required.
Are SaaS Financial Metrics Suitable for Every Startup?
No. SaaS metrics are designed around recurring customer relationships. Ecommerce, marketplace, and service startups often need additional measurements reflecting transaction costs, inventory, project profitability, and customer payment behavior.

Mobina Khanki
Venture & Funding Writer at PinerookMobina Khanki covers venture capital, startup funding, fundraising, and startup finance for Pinerook, focusing on founders and investors.
 Seen first.