
A prediction market can price an event at 80% and still be wrong when the result arrives. That does not automatically mean the market failed. A probability describes how often an outcome should occur across comparable situations, not a promise about one future event. The useful question is whether those probabilities prove reliable across many forecasts, made at comparable times and judged against the same outcomes.
In Prediction Markets, prices condense the views of participants willing to trade on future events. But a price is only a forecasting signal, and some signals are stronger than others. To evaluate prediction market accuracy, readers need more than a list of events the crowd called correctly. They need to understand calibration, scoring, timing, and the trading conditions behind the number.
Are prediction markets accurate?
They can be, particularly when many informed participants trade clearly defined contracts and new information reaches the market quickly. Research on election forecasting and newer exchange data show that market probabilities can contain valuable information. But there is no credible universal accuracy rate that applies to every platform, event category, or forecast horizon. An inflation contract observed an hour before a scheduled release is a different forecasting task from a company milestone contract observed six months ahead.
A useful distinction is between calling the winner and estimating the chance of winning. A market that labels every event a 90% favorite may report a high rate of correct calls because most of those events were easy. That alone does not show whether 90% was the right probability. Conversely, a 30% outcome occurring once is compatible with a well calibrated forecast. Accuracy is a record built from repeated predictions, not a verdict reached after one surprise.
Three ways to measure forecast quality
The simplest measure is hit rate: how often the outcome favored by the market actually occurs. It is intuitive, but it discards the difference between a narrow 51% favorite and a near certain 99% favorite. Two forecasters can post the same hit rate while taking very different levels of risk in their estimates.
Calibration asks a more useful question. If a large set of comparable events was priced near 70%, did roughly seven out of ten resolve Yes? A well calibrated market does not have to get every event right. Its confidence needs to match the frequency of outcomes over time. Calibration should also be checked by category and lead time; a convincing overall average can hide weak performance in a smaller group of contracts.
The Brier score measures the squared difference between an assigned probability and the result. For a binary contract, the score for a single forecast is (p − y)², where p is the probability between 0 and 1 and y is 1 when Yes happens or 0 when it does not. Lower average scores are better, provided the samples and scoring conventions are comparable.
How the metrics answer different questions
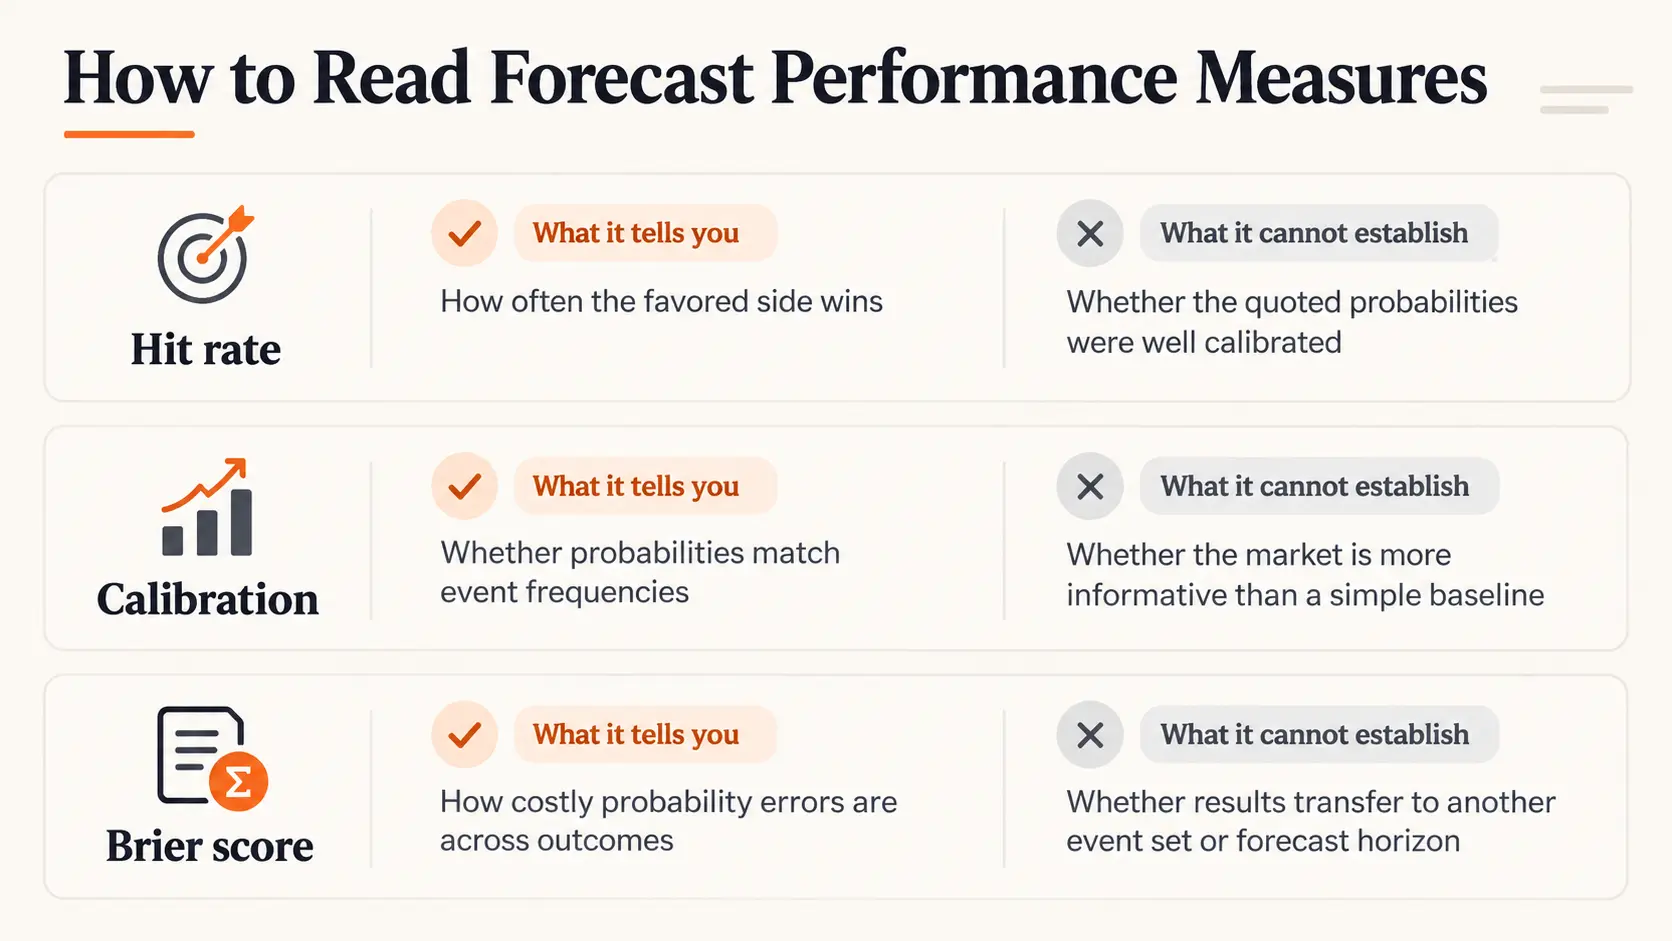
For a concrete example, imagine a contract priced at 70% before the result. If Yes occurs, its one term Brier score is (0.70 − 1)² = 0.09. If No occurs, it is (0.70 − 0)² = 0.49. Confident errors receive a larger penalty. A fair comparison averages scores over a disclosed set of forecasts and checks them against a baseline on the same questions. Different publications sometimes use a two outcome version of the Brier score that doubles the binary one term figure; their numbers should not be compared without checking the convention.
What the research actually shows
Long run academic evidence is encouraging but mixed. A study by Berg, Nelson, and Rietz in the International Journal of Forecasting (2008) compared Iowa Electronic Markets forecasts with 964 election polls and found the market closer to the eventual two party vote share 74% of the time in that historical sample. Other studies, however, have found that polling based forecasts can match or outperform markets under different methods. Those findings concern particular election periods and targets, not all types of prediction markets.
More recent platform data add scale, along with important limitations. An August 2026 Kalshi research paper evaluated more than 2.2 million resolved markets and reported improving calibration as resolution approached. Its analysis also found differences across categories and levels of participation. This is substantial evidence about one exchange, but it is operator published research and its results should not be assumed to describe every venue or every newly listed contract.
Polymarket also publishes an accuracy dashboard that reports higher hit rates close to resolution than a month beforehand. That pattern is plausible: as an event approaches, information accumulates and uncertainty often falls. Yet near event correctness is not the same as useful foresight months earlier. The dashboard reports its own chosen contracts, timestamps, and metrics; those details matter more than a headline percentage.
Why a market can display a misleading probability
Forecasts become harder to trust when the price represents little genuine competition. A wide gap between bids and offers, a stale last trade, or a thin order book can leave an apparently precise 64% quote resting on very little activity. Large trading volume does not automatically solve the problem: repeated trades or concentrated positions can inflate activity without bringing in independent information.
The makeup of the participants matters as much as their number. A market whose traders all react to the same rumor may appear to express collective intelligence while simply repeating one belief. An informed trader can correct a bad price, but only if the rules, capital requirements, and available liquidity make that trade feasible. Manipulation and asymmetric access to information are additional risks, especially where one participant has unusual influence over the price or the outcome itself.
Question design creates another source of error. “Will a startup launch its product in June?” sounds straightforward until the contract specifies a public launch, a particular time zone, and an official evidence source. A forecast cannot be graded fairly unless the event and its resolution terms are clear. Delays, cancellations, revised statistics, or disputed outcomes can make an apparently simple accuracy record more complicated than a platform headline suggests.
How to check the accuracy of a prediction market
Start with the exact claim and its timestamp
Identify what the contract asks, when its outcome becomes knowable, and what price was available before that moment. A probability recorded after the result was effectively public should not count as an early forecast. Decide whether the observation is a last trade, an order book midpoint, or an executable quote; each can tell a different story in an inactive market.
Look at a group of comparable resolved events
One memorable correct forecast is not an accuracy study. Prefer a defined group of contracts in the same category, with fixed observation horizons, clear exclusions, and a recorded final outcome. If several contracts depend on the same underlying event, count that dependence rather than treating each one as entirely independent evidence. The number of events matters alongside the number of contracts.
Use a probability score and a fair baseline
Check calibration across probability bands and compare Brier scores using the same formula, event sample, and timestamps. A baseline could be a simple historical event frequency or a separately produced statistical forecast. It is not meaningful to compare an exchange’s one hour ahead score against an analyst’s forecast made months earlier. If the reported method omits canceled or difficult contracts without explanation, treat the result cautiously.
Inspect trading depth and category differences
Look for active quotations, narrow spreads, and participation that reflects more than one source of information. Separate economic releases from entertainment, politics, and low attention markets rather than assuming identical reliability. Strong historical calibration in one category is evidence worth considering, not a license to trust every contract with the same confidence.
What accuracy means for founders and business readers
A founder may watch a market on interest rates, inflation, or an industry policy decision without intending to trade. The useful task is not to turn one price into a business forecast. It is to ask whether a sufficiently reliable market signal changes the relative weight assigned to alternative planning scenarios. A 60% market estimate can justify examining one scenario more closely, while leaving room for the other outcome.
For consequential decisions, compare the quote with official data, independent analysis, and the company’s own exposure. The business may be sensitive to the size of a policy move, not merely whether the move happens. That distinction can make an otherwise accurate Yes or No market an incomplete input. Prediction markets are most valuable when their uncertainty is interpreted correctly, rather than hidden behind a confident looking number.
Are prediction markets reliable enough for business decisions?
They can be a useful supplementary signal, particularly when contracts are clear and trading is active. Major decisions still require independent evidence and scenario analysis because forecasting accuracy does not eliminate the possibility of a costly surprise.
Prediction market accuracy is best judged by how well probabilities hold up across comparable events, not by the spectacle of one correct prediction. Calibration, Brier scores, observation timing, and market depth provide a more defensible standard. A price can be informative without being certain, and recognizing that boundary is what makes the forecast useful.
FAQ
Does an 80% forecast that fails mean the market was inaccurate?
Not on its own. Across many comparable 80% forecasts, about one in five should fail if the probabilities are well calibrated. A single outcome cannot establish whether the original 80% estimate was sensible.
Which prediction market is the most accurate?
There is no stable winner across all questions and time horizons. A useful comparison needs matched events, the same observation times, a consistent scoring method, and disclosed treatment of missing or disputed results. Platform wide accuracy figures alone do not provide that comparison.
Are prediction markets reliable enough for business decisions?
They can be a useful supplementary signal, particularly when contracts are clear and trading is active. Major decisions still require independent evidence and scenario analysis because forecasting accuracy does not eliminate the possibility of a costly surprise.

Masoumeh Jahangard
Markets & Economy Writer at PinerookMasoumeh Jahangard covers markets, economic trends, and business conditions for Pinerook, focusing on how they affect startups and growing companies.
 Seen first.