A prediction market shows a 62% chance that a specified event will happen. That looks like a clear forecast, but what does the number really mean? In a simple binary market, 62% usually comes from a Yes contract priced around 62 cents, with a $1 payout if the contract resolves in its favor. The conversion is straightforward. Interpreting it well takes more care.
The wider field of prediction markets explains how people trade on uncertain events. This guide focuses on the narrower task of reading the odds: identifying which quote is on screen, distinguishing a market estimate from a reliable forecast, and deciding whether the number is useful for economic analysis.
Why a 62 cent price suggests a 62% probability
For a binary Yes contract that pays $1 if an event occurs and $0 otherwise, the price provides a rough market implied probability. A 20 cent price suggests 20%; a 62 cent price suggests 62%; and a 90 cent price suggests 90%. The reasoning is that, ignoring costs and risk preferences, someone paying 62 cents for a possible $1 payout breaks even over many comparable events if roughly 62% of them occur.
This is a market estimate, not a measurement of objective certainty. The contract can be mispriced because of thin trading, shared assumptions, fees, hedging demand, or simply incomplete information. Even a well calibrated forecast at 70% will be wrong in approximately three of ten comparable cases. It is more accurate to say “the market implies about 70%” than “the event has a 70% chance.”
Read the Yes and No sides carefully
A standard two outcome contract has a Yes side and a No side. If a fully collateralized pair pays a combined $1 at resolution, a fair 35 cent Yes valuation is naturally paired with about 65 cents for No. But the prices you actually see on a trading screen may not total exactly $1. Different bid and ask quotations, fees, timing, and platform displays can make the two visible numbers look inconsistent.
First confirm that both quotes refer to the same event, deadline, and settlement conditions. A contract about a central bank decision at its next meeting is not interchangeable with one about any decision before year end, even if their headlines sound similar.
The displayed percentage is not always the price you can trade
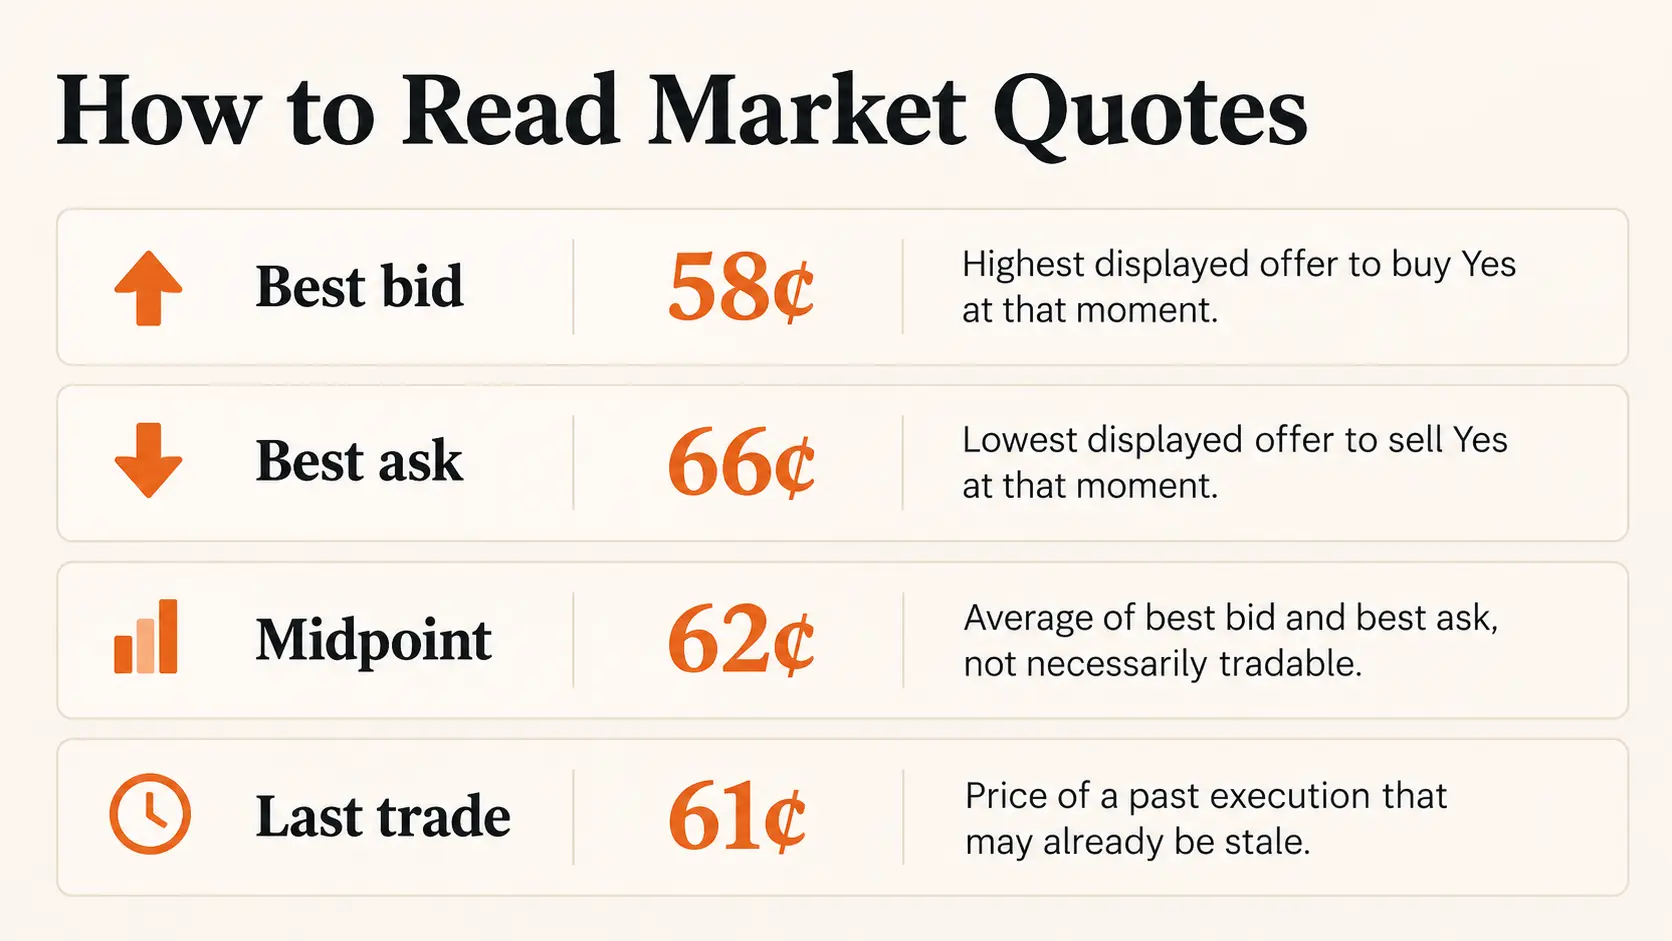
Most beginners look only at the prominent probability displayed beside the contract. An order book, however, separates the highest price a buyer is offering (bid) from the lowest price a seller is asking (ask). The space between them is the bid ask spread. Some venues show a midpoint or a recent transaction as the headline probability, which can differ from the price available to a new buyer.
Imagine the best Yes bid is 58 cents and the best ask is 66 cents. The midpoint is 62 cents, but a person seeking immediate execution may need to pay 66 cents. A seller seeking immediate execution may receive only 58 cents. The 62% headline is therefore a shorthand for the market view, not a guaranteed executable quote.
What fees do to the price to probability shortcut
Suppose the available Yes ask is 66 cents and an illustrative transaction fee adds 2 cents per contract at entry. The all in purchase cost is 68 cents. If the contract pays $1 upon a Yes resolution, the net gain is 32 cents in that outcome and the full 68 cent cost is lost if it resolves No. Under these simplified assumptions, the break even event probability is 68%, not the 62% midpoint displayed on the screen.
Real fee schedules vary, and some charge different amounts or at different points in a transaction. This example is a reading exercise rather than a claim about current platform fees. The larger lesson is that a displayed market probability and the economics of an actual transaction are related but distinct.
Why prediction market odds change
A market may reprice an event when an official report, new polling result, corporate announcement, or policy statement alters expectations. A move from 40 cents to 60 cents can indicate that traders now assign more weight to the Yes outcome. It does not prove the underlying event became exactly 20 percentage points more likely in reality.
Orders also move prices when no important information has changed. In a quiet market, a few trades may move the last price substantially. To interpret a sudden shift, check whether the bid and ask have moved together, whether other independent information supports the change, and whether the contract terms remained the same. A price chart without that context is an incomplete record of the market’s beliefs.
Three checks before using the odds in a business decision
Read the exact resolution question
Does the contract require a specific official publication, a threshold, or a decision before a named deadline? “A rate cut this year” and “a rate cut at the next meeting” describe different probabilities. Resolution details matter more than the shortened market title.
Look beyond the headline percentage
Check the bid, ask, recent trade, and any available depth near those prices. If the spread is wide or the quoted price is stale, avoid reporting a precise point estimate. The sensible interpretation may be a broad range, with a clear note that the market is thin.
Compare the estimate with other evidence
For economic events, compare the implied probability with the published calendar, relevant data, and reputable forecasts. An apparent market consensus becomes more useful when it reflects several independent sources of information rather than a widely repeated assumption.
A practical example for startup planning
Imagine a founder tracking an event contract tied to a central bank decision. The displayed Yes probability rises from roughly 45% to 65% during the month. The change may justify giving the corresponding financing cost scenario more attention, but it does not justify changing the company’s hiring plan on its own. The founder should first verify the contract deadline, check whether the price is tradable, and compare it with central bank statements and other market indicators.
A useful application is scenario planning: document what happens to cash runway if funding costs remain unchanged, fall, or rise. Prediction market odds can help prioritize which scenario to monitor. They cannot tell a founder how large the business impact will be, or replace a budget built around actual cash obligations.
The most common mistake: treating a probability as a promise
A market quoting 90% still leaves substantial room for the opposite result. High confidence does not eliminate event risk, and the quoted percentage may reflect conditions that deteriorate before resolution. Analysts should preserve the difference between a conditional estimate at a particular timestamp and what ultimately happened.
Good interpretation starts with three questions: what exact event pays $1, which price is being displayed, and what limits the quality of that price? Answering them is more valuable than adding extra decimal places to the probability.
FAQ
Are prediction market odds the same as actual probability?
No. They are market implied estimates derived from prices. Liquidity, incentives, fees, participant views, and contract design can all make the price different from a well calibrated forecast.
If Yes is 30%, does No have to be 70%?
In a simple binary contract, their underlying settlement values are complementary. But displayed Yes and No quotes may not add to exactly 100% because they can refer to different sides of a spread or different recent trades.
Why can’t I buy at the percentage shown on the screen?
The headline number may represent a midpoint or last traded price. The best ask is generally the relevant starting quote for an immediate purchase, subject to available quantity and fees.
Does a 90% market quote mean the event is almost certain?
It means the market is assigning a high implied likelihood at that moment. The event can still fail to occur, and the quote may move as new information arrives.

Masoumeh Jahangard
Markets & Economy Writer at PinerookMasoumeh Jahangard covers markets, economic trends, and business conditions for Pinerook, focusing on how they affect startups and growing companies.
 Seen first.